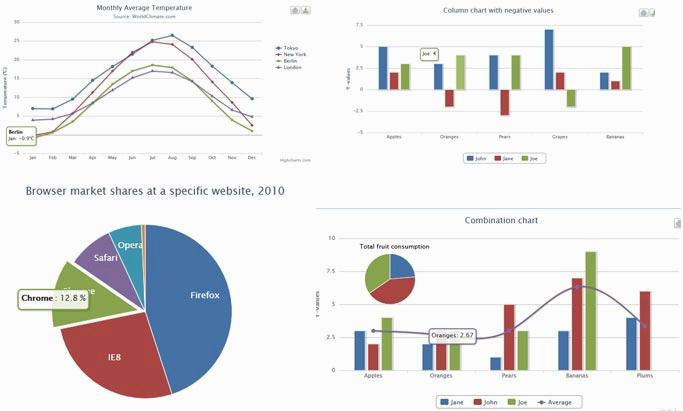
类似cpu趋势变化图表示例
var chart;
			$(document).ready(function() {
				chart = new Highcharts.Chart({
					chart: {
						renderTo: 'container',
						defaultSeriesType: 'spline',
						marginRight: 10,
						events: {
							load: function() {

								// set up the updating of the chart each second
								var series = this.series[0];
								setInterval(function() {
									var x = (new Date()).getTime(), // current time
										y = Math.random();
									series.addPoint([x, y], true, true);
								}, 1000);
							}
						}
					},
					title: {
						text: 'Live random data',
						style: {
							margin: '10px 100px 0 0' // center it
						}
					},
					xAxis: {
						type: 'datetime',
						tickPixelInterval: 150
					},
					yAxis: {
						title: {
							text: 'Value'
						},
						plotLines: [{
							value: 0,
							width: 1,
							color: '#808080'
						}]
					},
					tooltip: {
						formatter: function() {
				                return '<b>'+ this.series.name +'</b><br/>'+
								Highcharts.dateFormat('%Y-%m-%d %H:%M:%S', this.x) +'<br/>'+
								Highcharts.numberFormat(this.y, 2);
						}
					},
					legend: {
						enabled: false
					},
					exporting: {
						enabled: false
					},
					series: [{
						name: 'Random data',
						data: (function() {
							// generate an array of random data
							var data = [],
								time = (new Date()).getTime(),
								i;
							for (i = -19; i <= 0; i++) {
								data.push({
									x: time + i * 1000,
									y: Math.random()
								});
							}
							return data;
						})()
					}]
				});


			});